Presented at Devoxx France 2015 by Gil Tene, CTO of Azul Systems
Summary by Thomas SCHWENDER (Softeam StarTech Java)
A few words on Gil and his company: Azul Systems
Gil has a long history of working on Garbage Collectors and GC algorithms, Virtual Machines, Operating Systems and Enterprise apps.
Azul Systems is a high-technology company specialised in performance, real time business, for the Java world. It is the editor of:
Summary
In this talk, Gil discusses:
-
common pitfalls encountered in measuring and characterizing latency.
The main idea being that good characterization of bad data isn’t worth a penny. -
ways to address those pitfalls using some new open source tools.
What matters with latency is BEHAVIOR
Latency, response time, round trip: all that are the same thing. But, if we want a definition, let’s say:
| Latency is the time it took one operation to happen |
And what matters in latency is its behavior, its WHOLE, REAL behavior.
As latency doesn’t follow a normal distribution, we can’t "feel" what will be its worst cases from an average, or from the 90%, 99%, 99.99% most favorable cases.
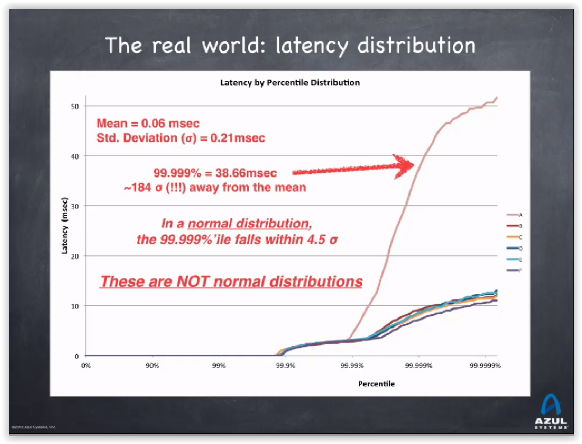
Dealing with Hiccups
Gil calls those unpredictable "bad" cases Hiccups.
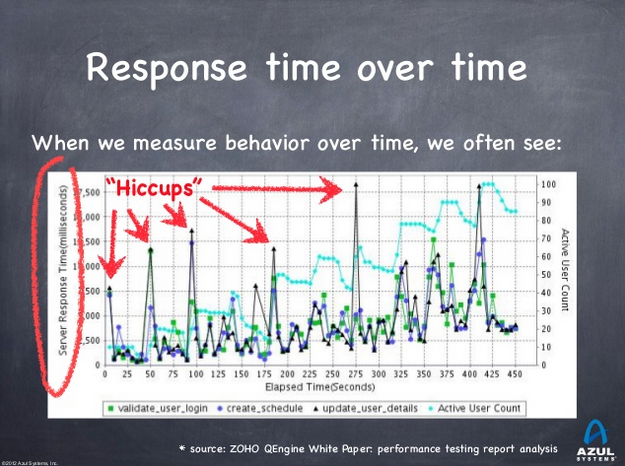
Those hiccups:
-
are generally NOT correlated to load
-
can happen because of "noise"
-
can happen because periodic events (garbage collection)
-
can happen because of cumulated work you have to pay for (ex: you had the CPU for the last 10 ms, and now that’s somebody else turn)
-
look like periodic freezes
The big problem with Hiccups is that, most of time, when you ask people "how does behave the 99% of that", they answer by a projection based on the data they have, and not with the real data.
As we saw that those data, those Hiccups, are unpredictable, this answer is always bad.
To deal with them, we need real data, and numerous ones. Once we have them, we can ask for some Service Level Requirements based on a real behavior:
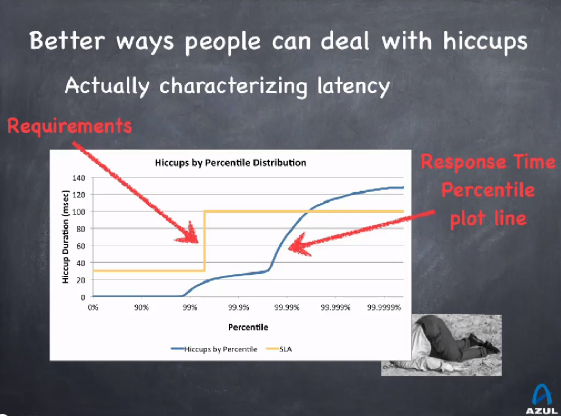
From there, if the latency behavior doesn’t match the requirements, we know where to focus our efforts.
Requirements
-
Latency requirements are usually a list of PASS/FAIL tests based on some predefined criteria.
-
And measurements should provide data to evaluate those requirements.
So be sure to have the requirements established exhaustively, with no case forgotten. An example of correct Service Level Requirements for latency:
-
50% better than 20 msec
-
90% better than 50 msec
-
99.9% better than 500 msec
-
100% better than 2 seconds
A notion to remember:
| Sustainable throughput: the throughput achieved while safely maintening service levels |
The coordinated omission problem
Gil explains that some dreadful omissions are done when load testing or monitoring:
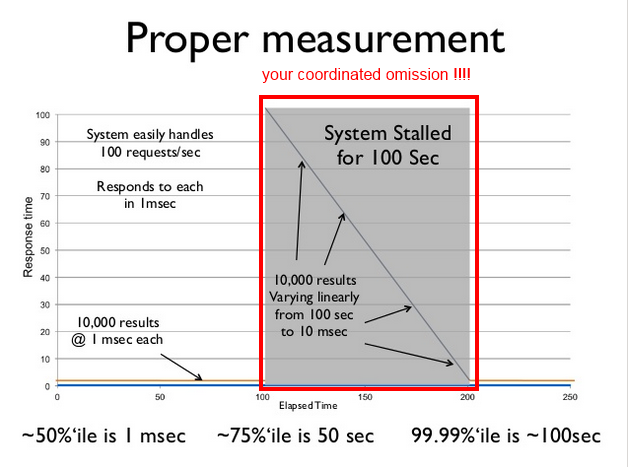
For load tests, we generally expect all requests to have the same duration, to be sent at a certain rate.
| But it doesn’t work if requests are sent in an uncoordinated way. |
For monitoring, we generally measure latency between the start and end of each operation.
|
But it only works when no queuing occurs. |
Example:
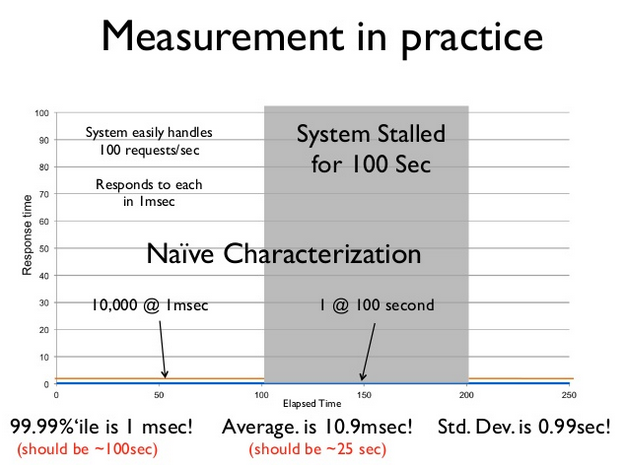
| The solution: to test other cases ! |
-
vary the duration of the requests
-
test those other duractions in big number
-
do not hesitate to freeze the system while testing (to create a request engorgement)
-
always measure Max time.
How to detect those coordinated omission?
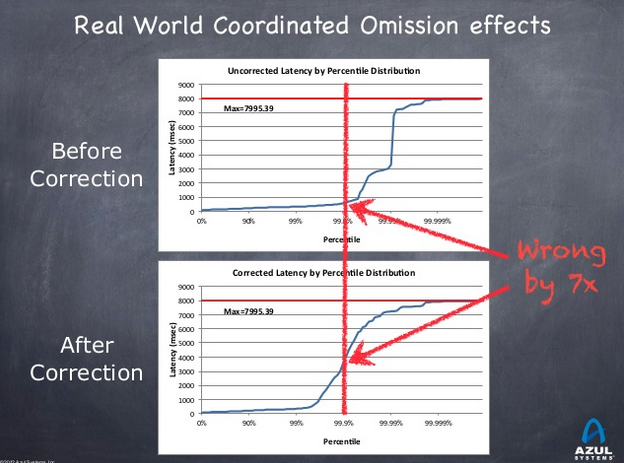
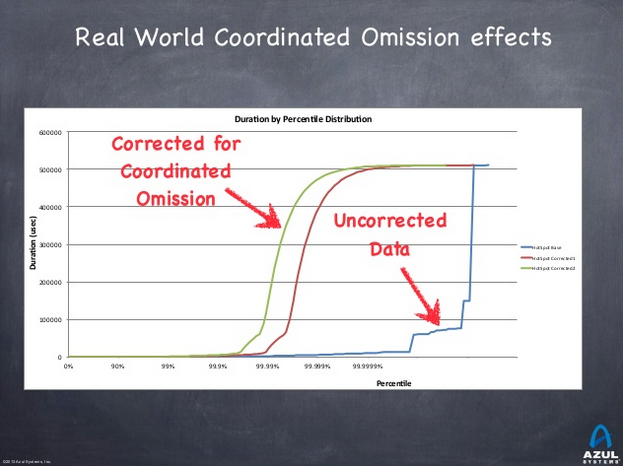
If, in an uncorrected metric, you see a vertical rise, think it is probably a coordinated omission.
Examples:
|
Those omissions are present in a LOT OF tools (JMeter & Co). |
Some tools
-
HdrHistogram: a High Dynamic Range Histogram.
-
covers a configurable dynamic value range (ex: track values between 1 ms and 1 hour)
-
built-in compensation for Coordinated Omission
-
-
JHiccup: a tool for capturing and displaying platform hiccups
-
records any observed non-continuity of the underlying platform
-